
1. Overview
Issue Status Time Analyzer is a powerful JIRA analytics tool that tracks and measures the time issues spend in different workflow statuses. It provides detailed insights into your team's development process, helping identify bottlenecks and optimize workflow efficiency.
What it does:
- Automatically tracks time spent in each JIRA status
- Provides real-time analytics and historical reporting
- Identifies workflow bottlenecks and inefficiencies
- Generates detailed reports for stakeholders
- Supports custom status groupings and filters
2. Getting Started
Prerequisites
- JIRA Cloud or Server instance (version 8.0+)
- Admin permissions to install and configure apps
- Active JIRA projects with workflow statuses
Installation Steps
- Navigate to JIRA Administration → Manage Apps
- Search for "Issue Status Time Analyzer" in the Atlassian Marketplace
- Click "Install" and accept the permissions
-
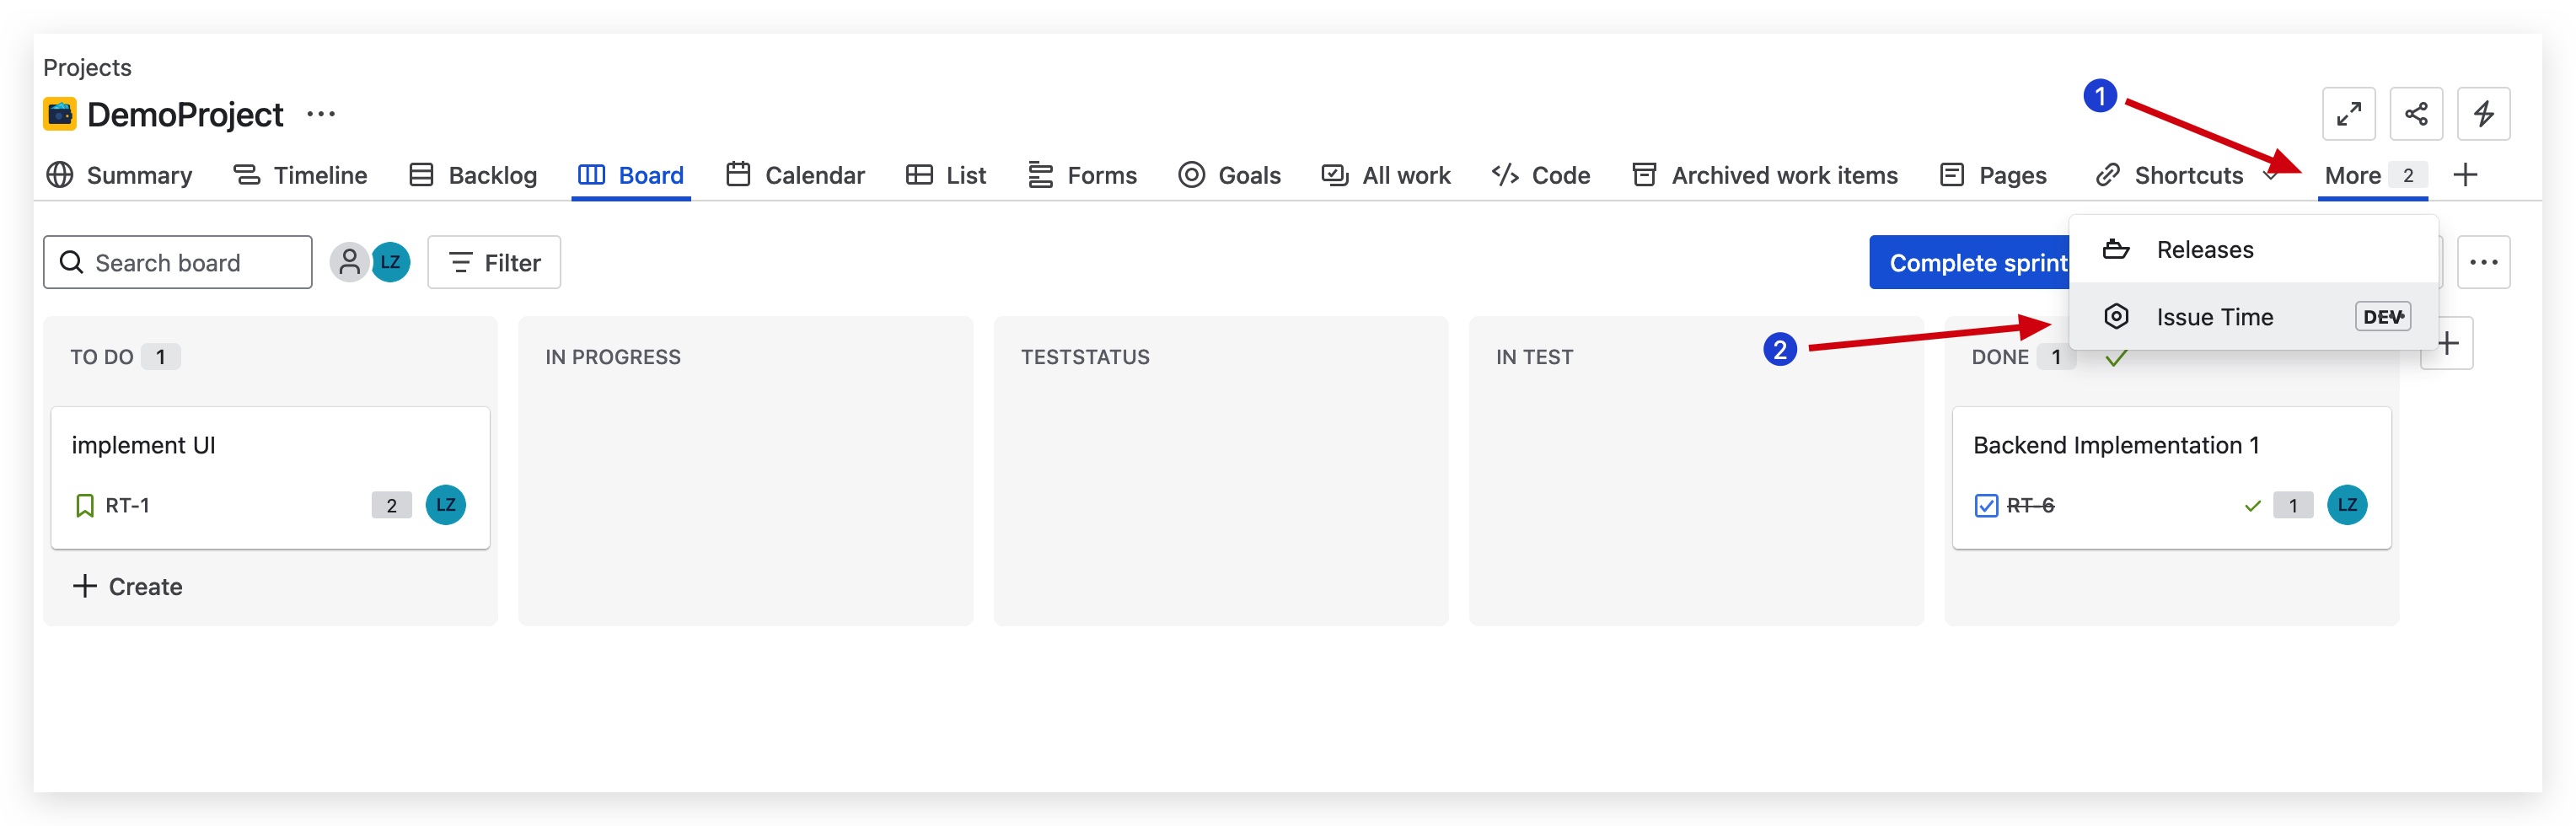
Add the app to your project navigation menu:
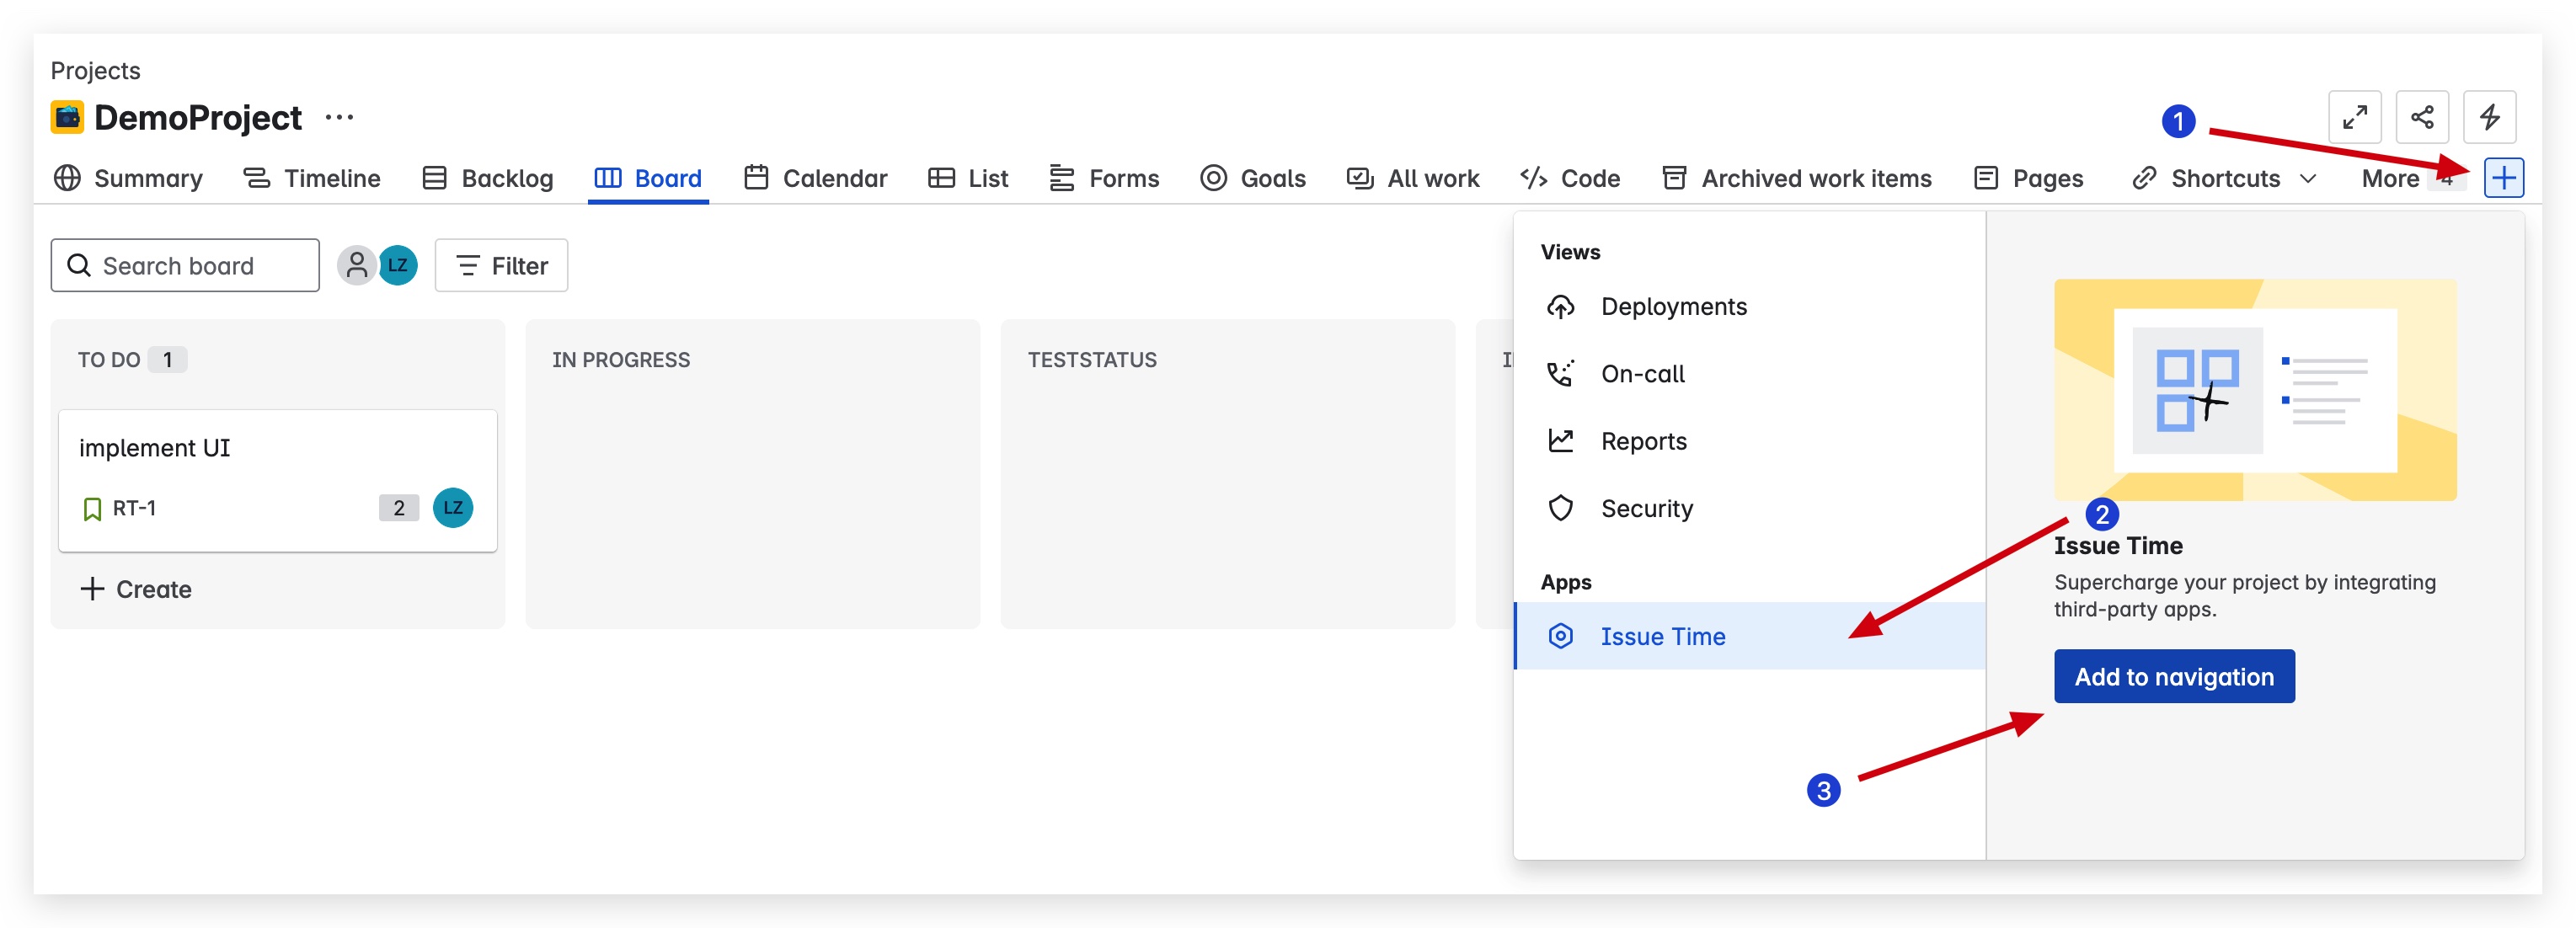
Navigate to your project settings and add the Issue Status Time Analyzer to the project menu.
- Configure your first project (see Configuration section below)
- Start tracking! Data collection begins immediately
3. Key Features
Real-time Tracking
Automatically captures status transitions as they happen, providing accurate time measurements without manual intervention.
Advanced Analytics
Generate comprehensive reports with average times, percentiles, trends, and bottleneck identification.
Custom Filters
Filter data by project, issue type, assignee, priority, labels, or any custom field to get targeted insights.
Export & Integration
Export reports to CSV, Excel, or PDF. Integrate with BI tools via REST API for advanced analysis.
4. Configuration
Accessing the App
Once installed, you can access Issue Status Time Analyzer from your project navigation menu:
The app appears in your project sidebar for easy access to analytics and configuration.
Default Dashboard
When you first open the app, you'll see the default dashboard:
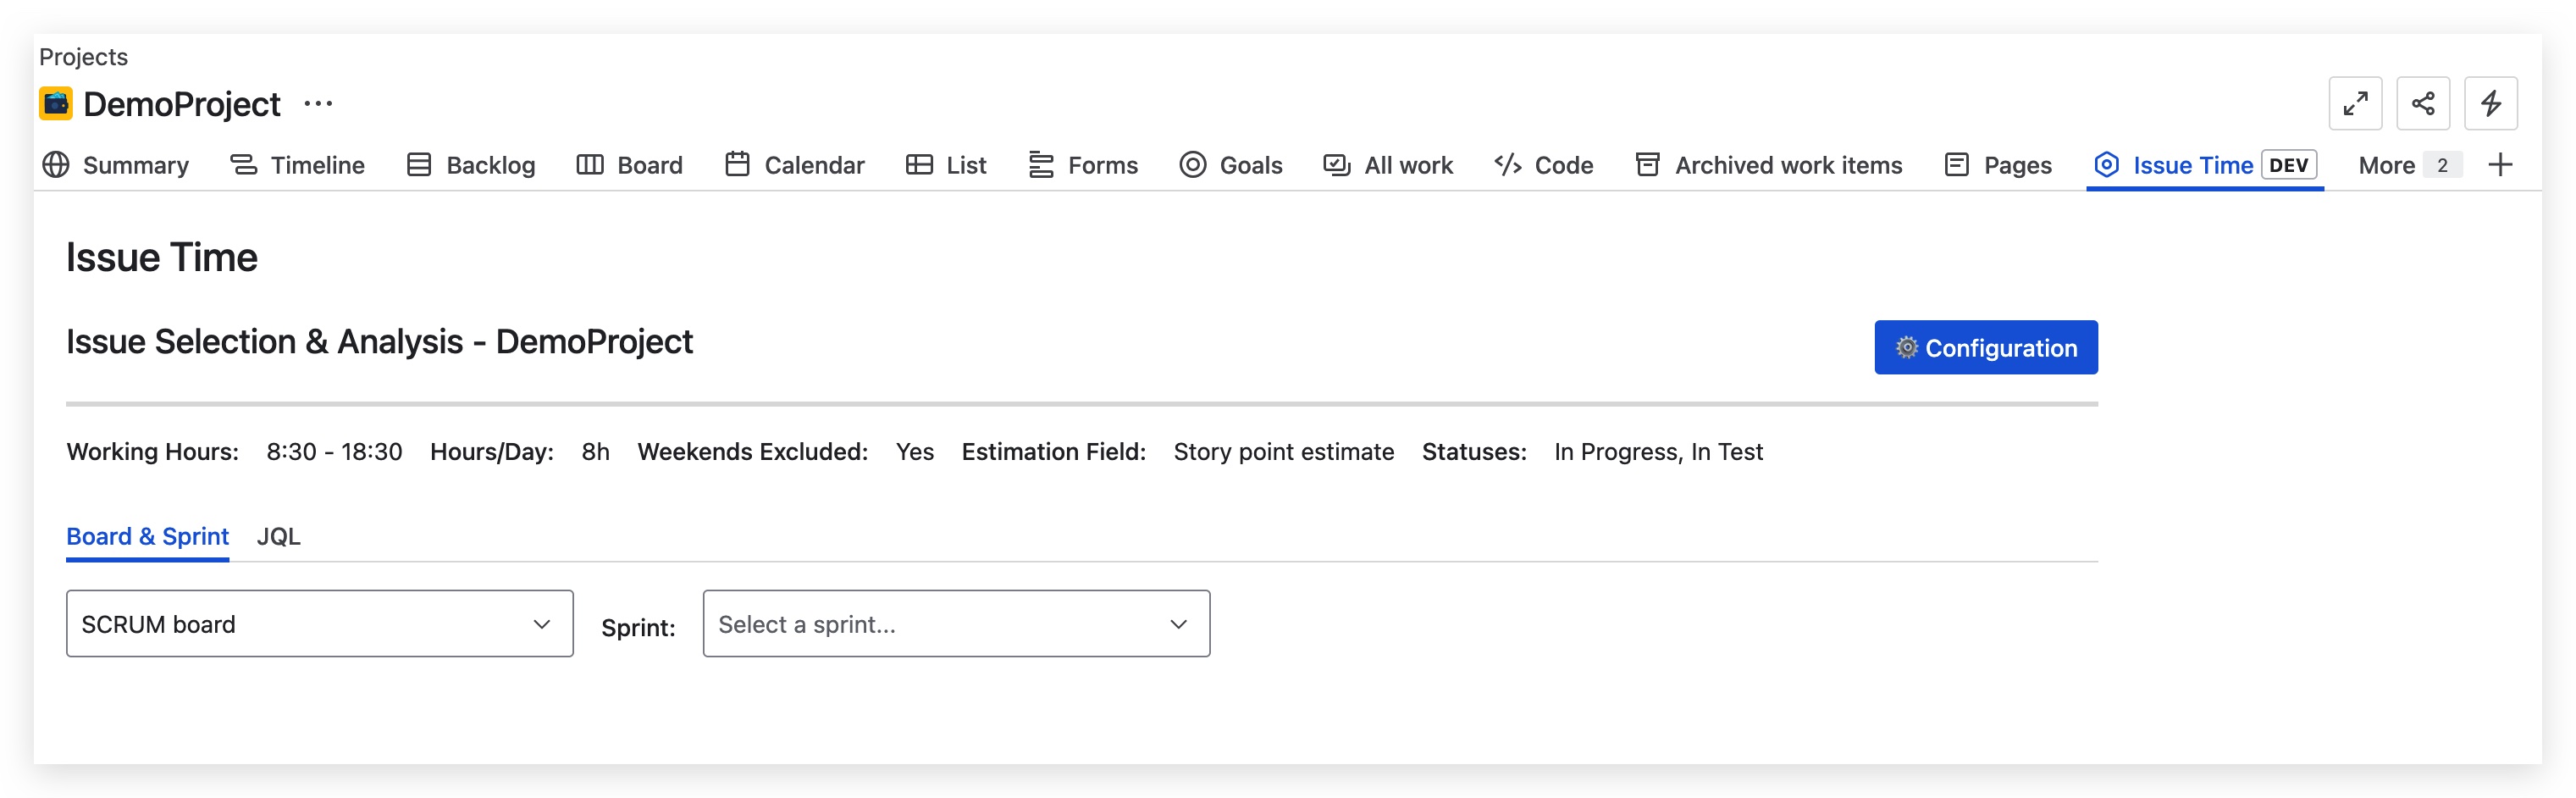
The default view provides an overview of your project's issue status analytics and quick access to key features.
Configuration Page
Access the configuration page to customize your tracking settings:
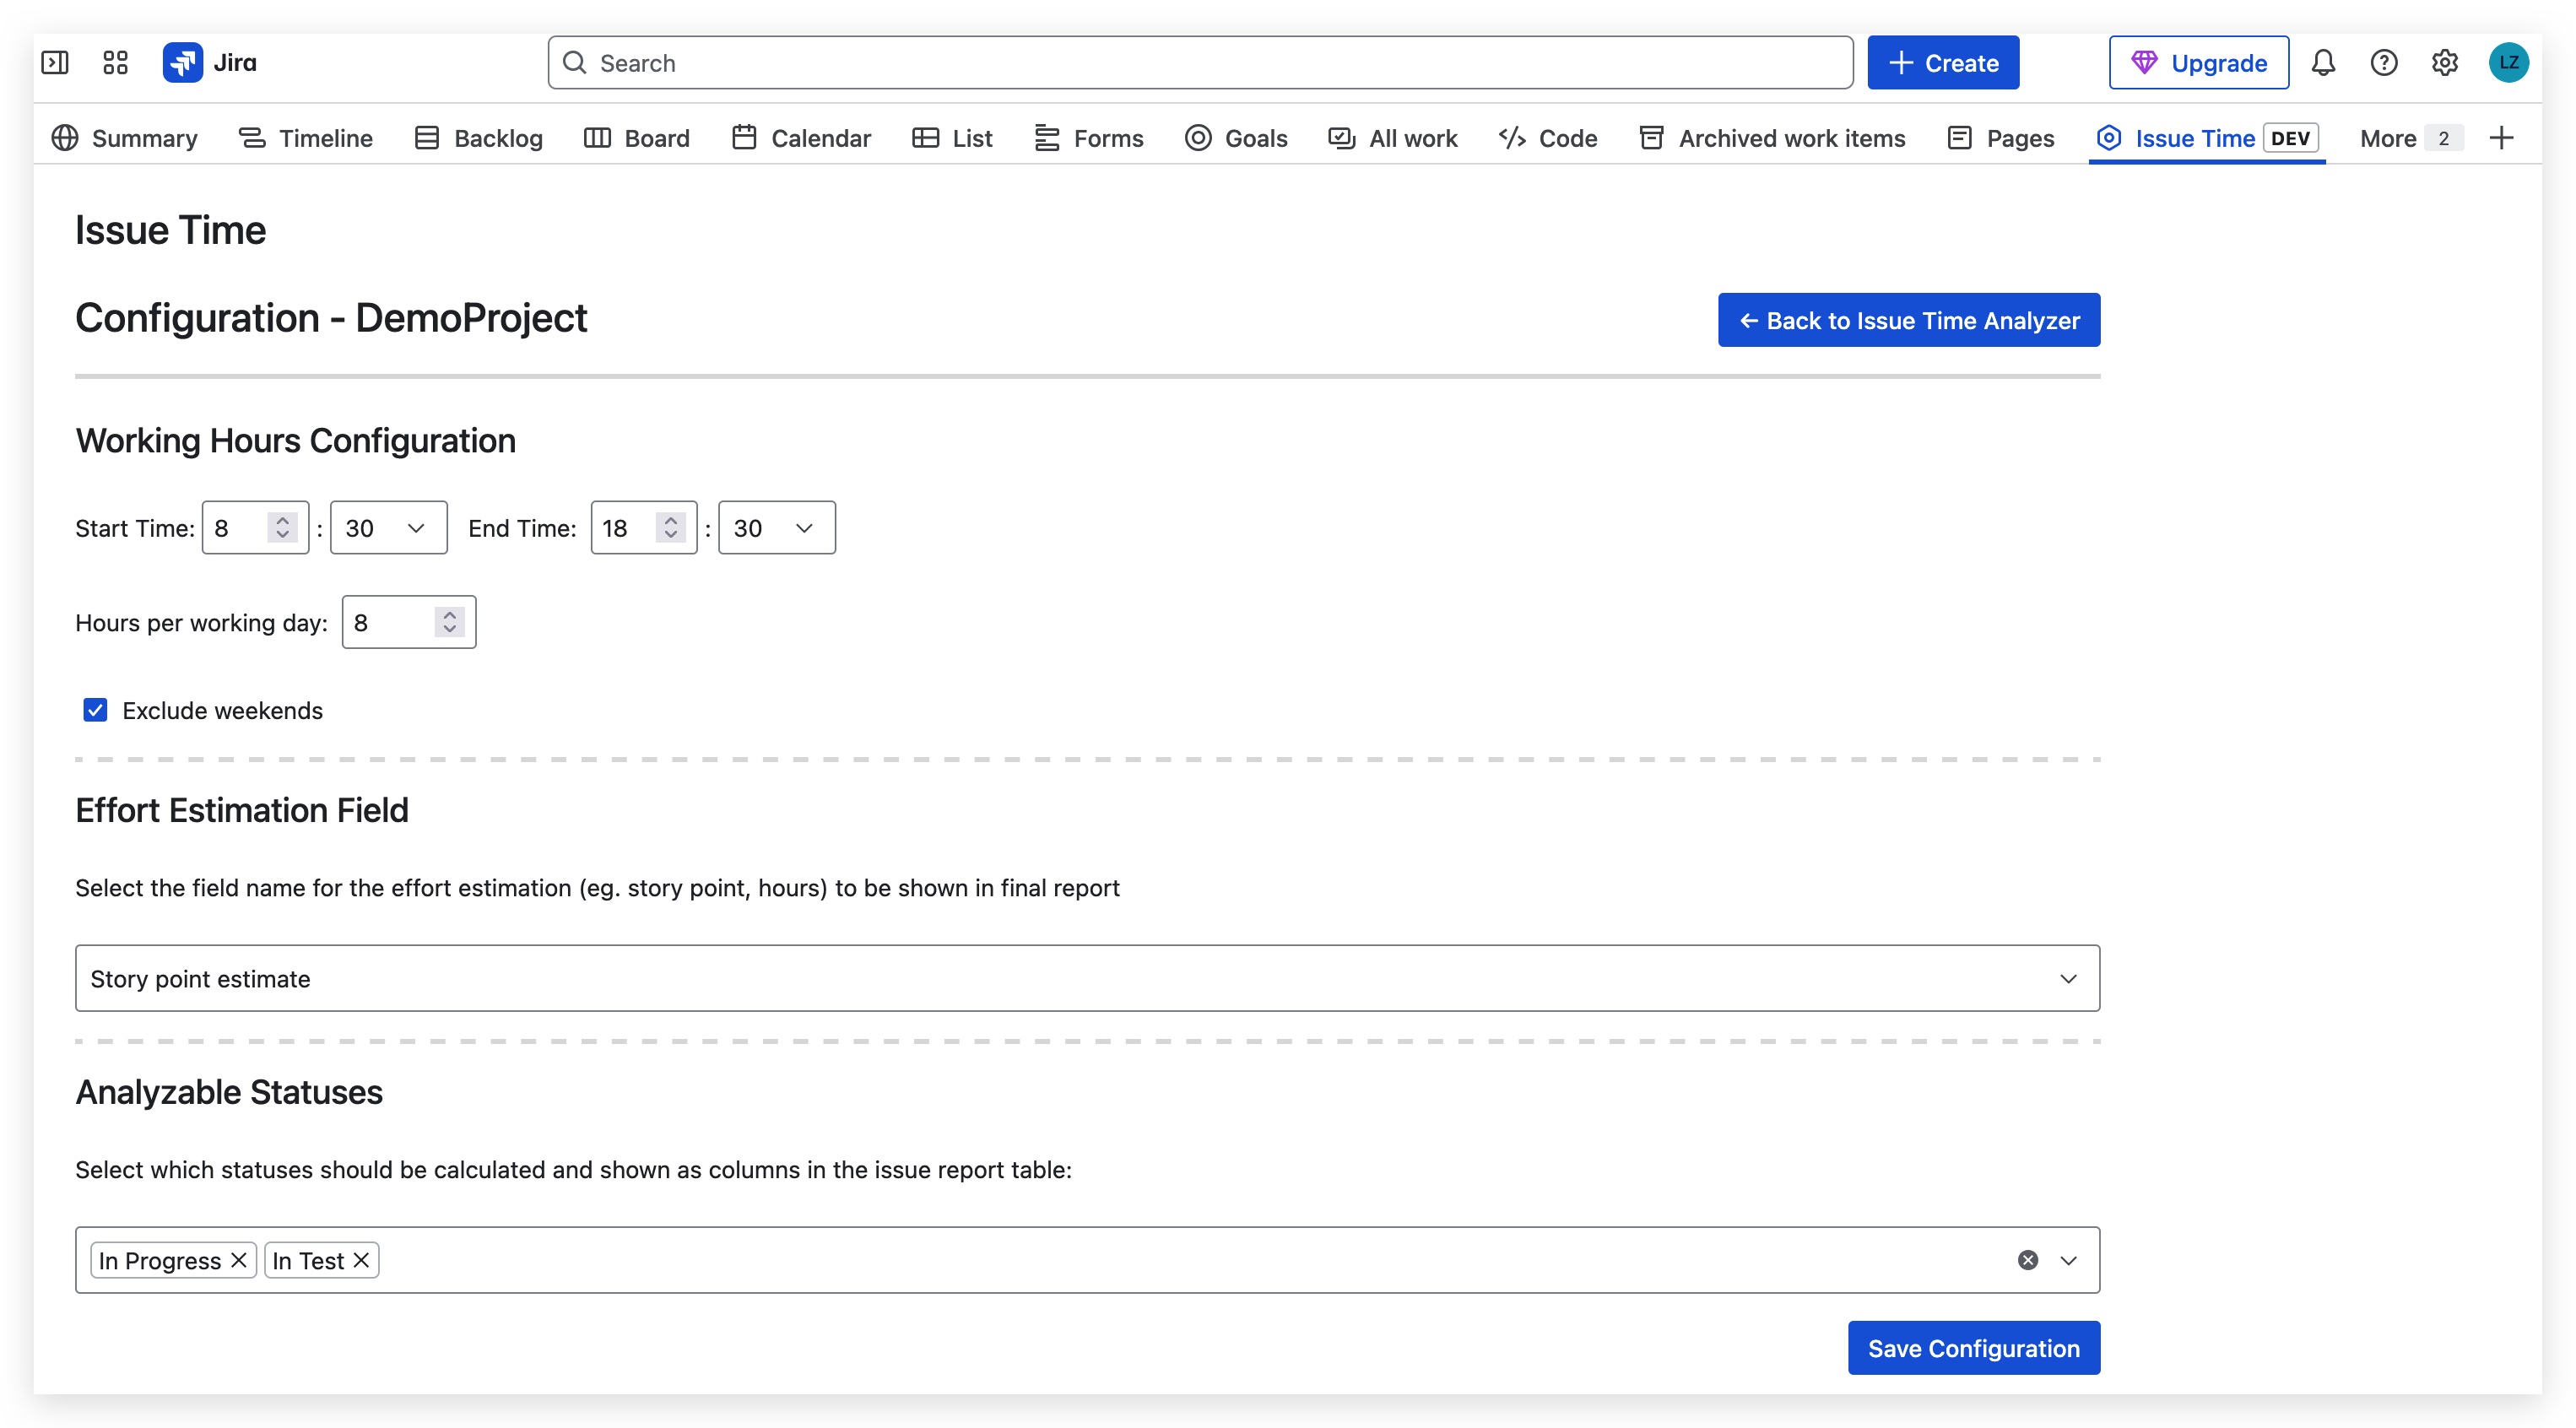
Configuration Options:
- Enable/disable tracking for specific issue types
- Configure business hours and working days
- Set up status groupings and mappings
- Configure notification preferences
- Set data retention policies
Status Groupings
Group similar statuses together for better analysis. For example, group "In Review" and "Code Review" into a "Review" category.
| Default Group | Common Statuses | Description |
|---|---|---|
| To Do | Open, To Do, Backlog | Issues waiting to be started |
| In Progress | In Progress, Development | Active development work |
| Review | Code Review, In Review, QA | Review and testing phases |
| Done | Done, Resolved, Closed | Completed issues |
5. Analytics & Reports
Sprint Issue Analysis
Load and analyze issues from specific sprints to understand team performance:
Loading Sprint Issues
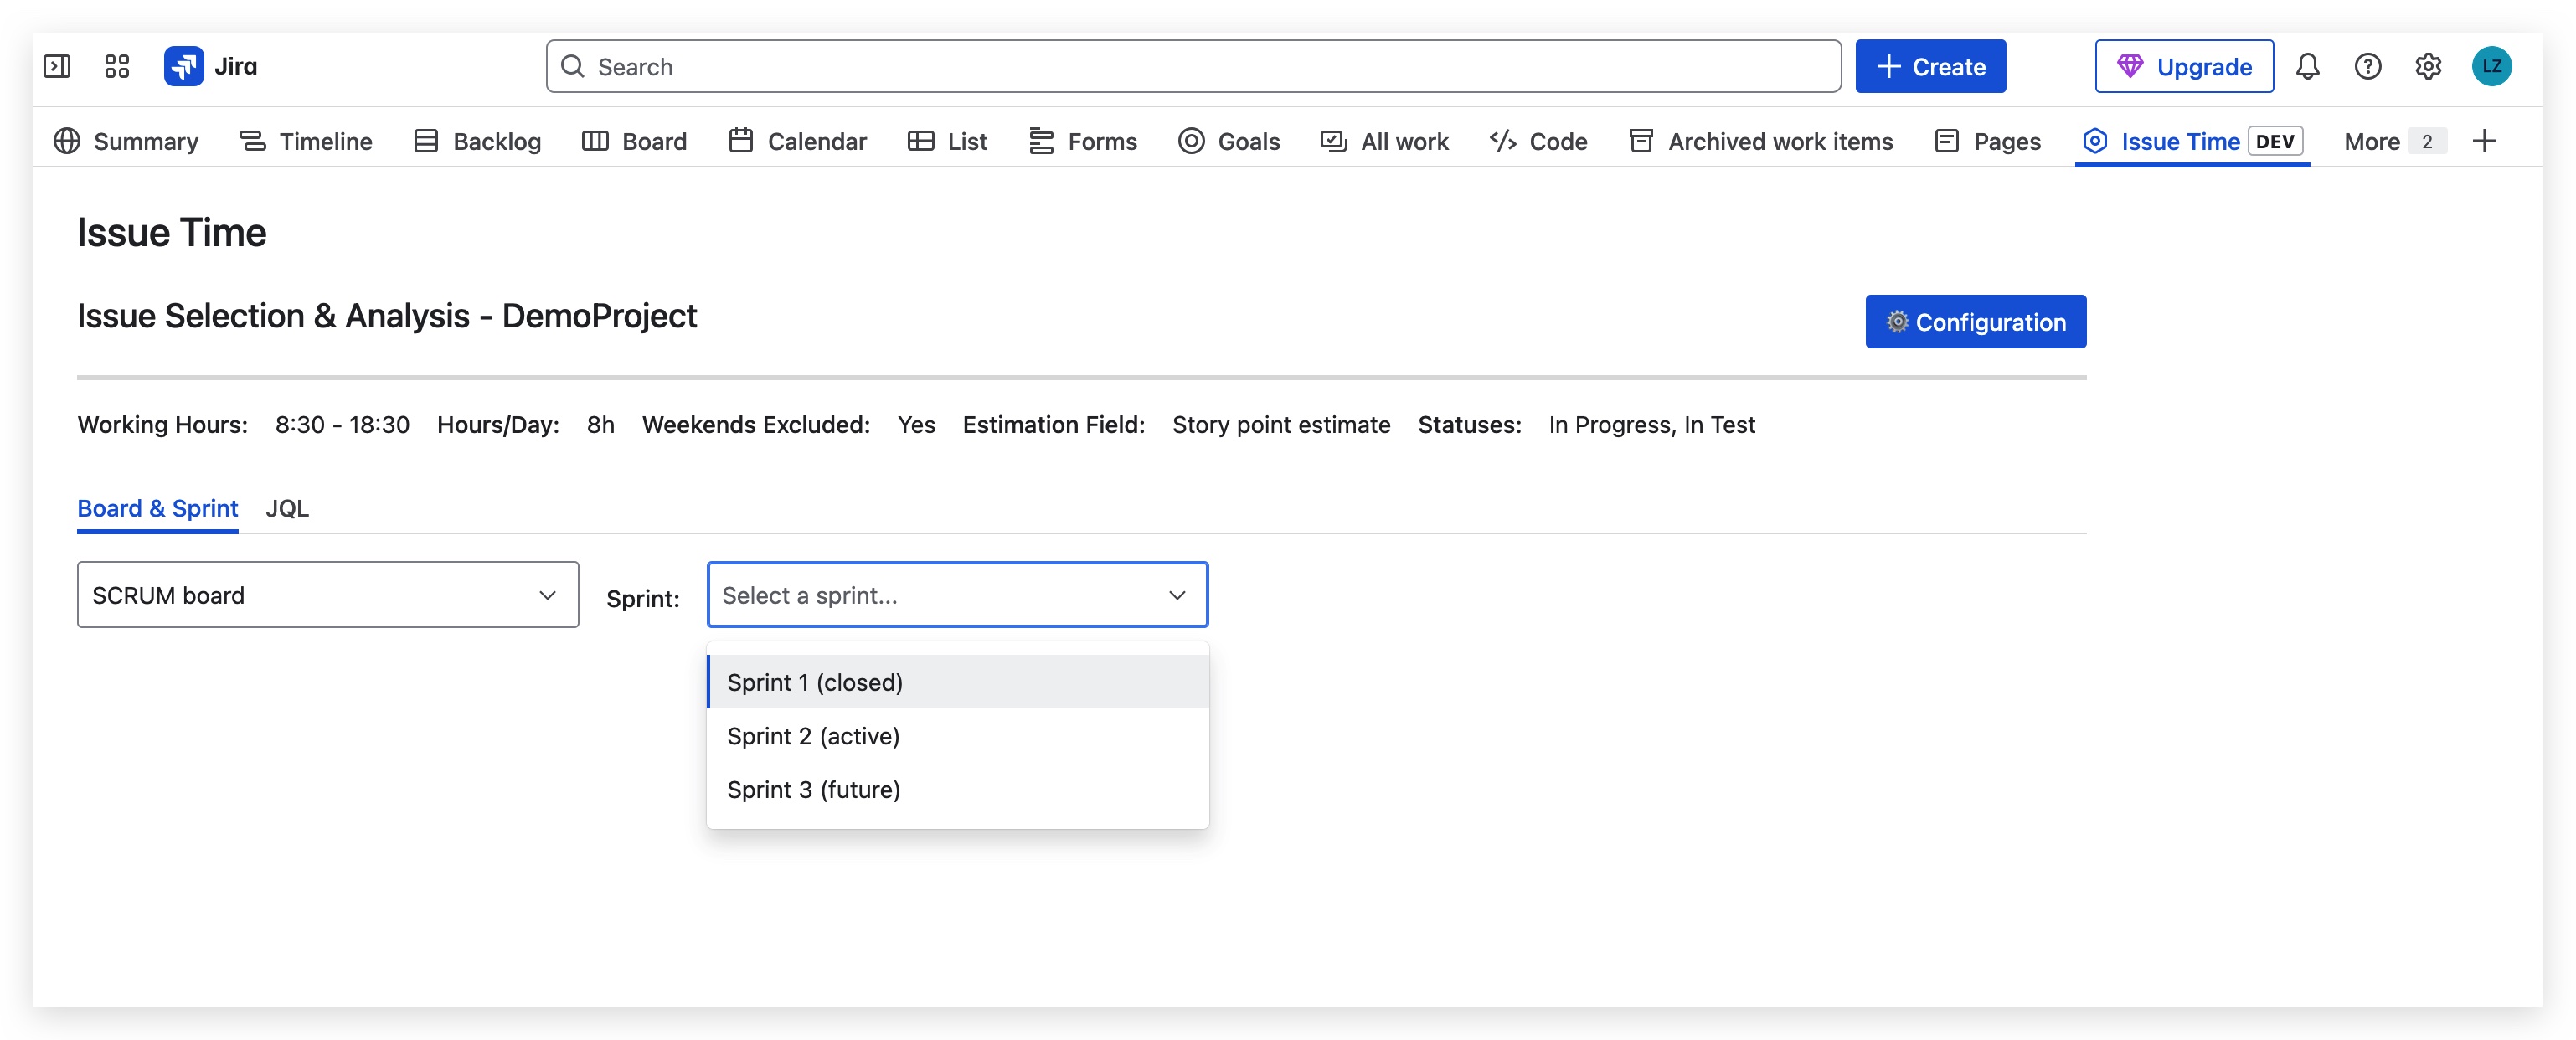
Select a sprint from your project to load all associated issues for analysis.
Sprint Issues List

View all issues in the selected sprint with their current status and time tracking information.
JQL-Based Issue Fetching
Use custom JQL queries to fetch and analyze specific sets of issues:

JQL Query Examples:
Issue Analysis Results
View detailed analysis results for individual issues and overall trends:
Individual Issue Analysis

Detailed breakdown of time spent in each status for individual issues.
Comprehensive Analysis Report

Overall analysis showing trends, averages, and bottlenecks across multiple issues.
Report Types
Status Time Distribution
Shows average, median, and percentile times spent in each status across selected issues.
Use case: Identify which statuses take the longest and need optimization.
Bottleneck Analysis
Automatically identifies workflow stages where issues spend disproportionately long times.
Use case: Focus improvement efforts on the most impactful workflow stages.
Trend Analysis
Track how status times change over time to measure the impact of process improvements.
Use case: Validate that workflow changes are actually improving efficiency.
Creating Custom Reports
- Navigate to Reports → Status Time Analyzer
- Select the report type you want to generate
- Apply filters (project, date range, issue type, etc.)
- Configure groupings and aggregations
- Generate the report and export if needed
6. Troubleshooting
Common Issues
No data appearing in reports
- Ensure tracking is enabled for the project
- Check that issues have been transitioned after installation
- Verify your date range includes recent activity
Incorrect time calculations
- Check if business hours are configured correctly
- Verify timezone settings match your team's location
- Ensure status mappings are set up properly
Performance issues with large datasets
- Use smaller date ranges for reports
- Apply filters to reduce the dataset size
- Consider archiving old data
7. API Reference
REST API Endpoints
Get Status Times
Returns time spent in each status for issues in the specified project.
Get Issue Timeline
Returns the complete status transition timeline for a specific issue.
Generate Report
Generates a custom report based on the provided parameters.
8. Frequently Asked Questions
How accurate is the time tracking?
Time tracking is highly accurate as it captures actual JIRA status transitions. The tool accounts for business hours, weekends, and holidays based on your configuration. Times are calculated to the minute.
Can I track time retroactively?
Yes, the tool analyzes historical issue activity from your JIRA instance to provide retroactive tracking. However, the most accurate data comes from tracking enabled going forward.
How does it handle weekend and holiday time?
You can configure business hours and holiday calendars. The tool can either include or exclude non-business time from calculations based on your preferences.
What permissions are required?
Users need "Browse Projects" permission to view reports for projects they have access to. Admin permissions are required for configuration and app management.
Can I export the data?
Yes, all reports can be exported to CSV, Excel, or PDF formats. You can also access raw data via the REST API for integration with external tools.